The population of a city not only embodies the social sources that mobilize its future development, but also reflects the significant periods of the city’s social history. The social historical developments in post-1923 Turkey can be examined under three different regimes of accumulation and regulation.1 Each of these periods of time, roughly a quarter of a century long, had different accumulation regimes, legal frameworks, connections with the outside world, social processes as well as different population structures. After the first 25 years of the Republic, Istanbul lost its character as an imperial city and took up a relative position within the nation-state borders. The city went through this period in a state of stability that had not been experienced before. In the post-World War II period, urbanization accelerated, immigration to Istanbul proliferated and the second quarter period started. In this period, the rate of population growth increased, the population density increased in the city center, with migration from the country to the city, and the demographic characteristics of the population began to change. After the 1980s, with the impact of global dynamics, Istanbul again became a world city again, the population spread outwards and parallel urban structures were included in the process of urban formation.
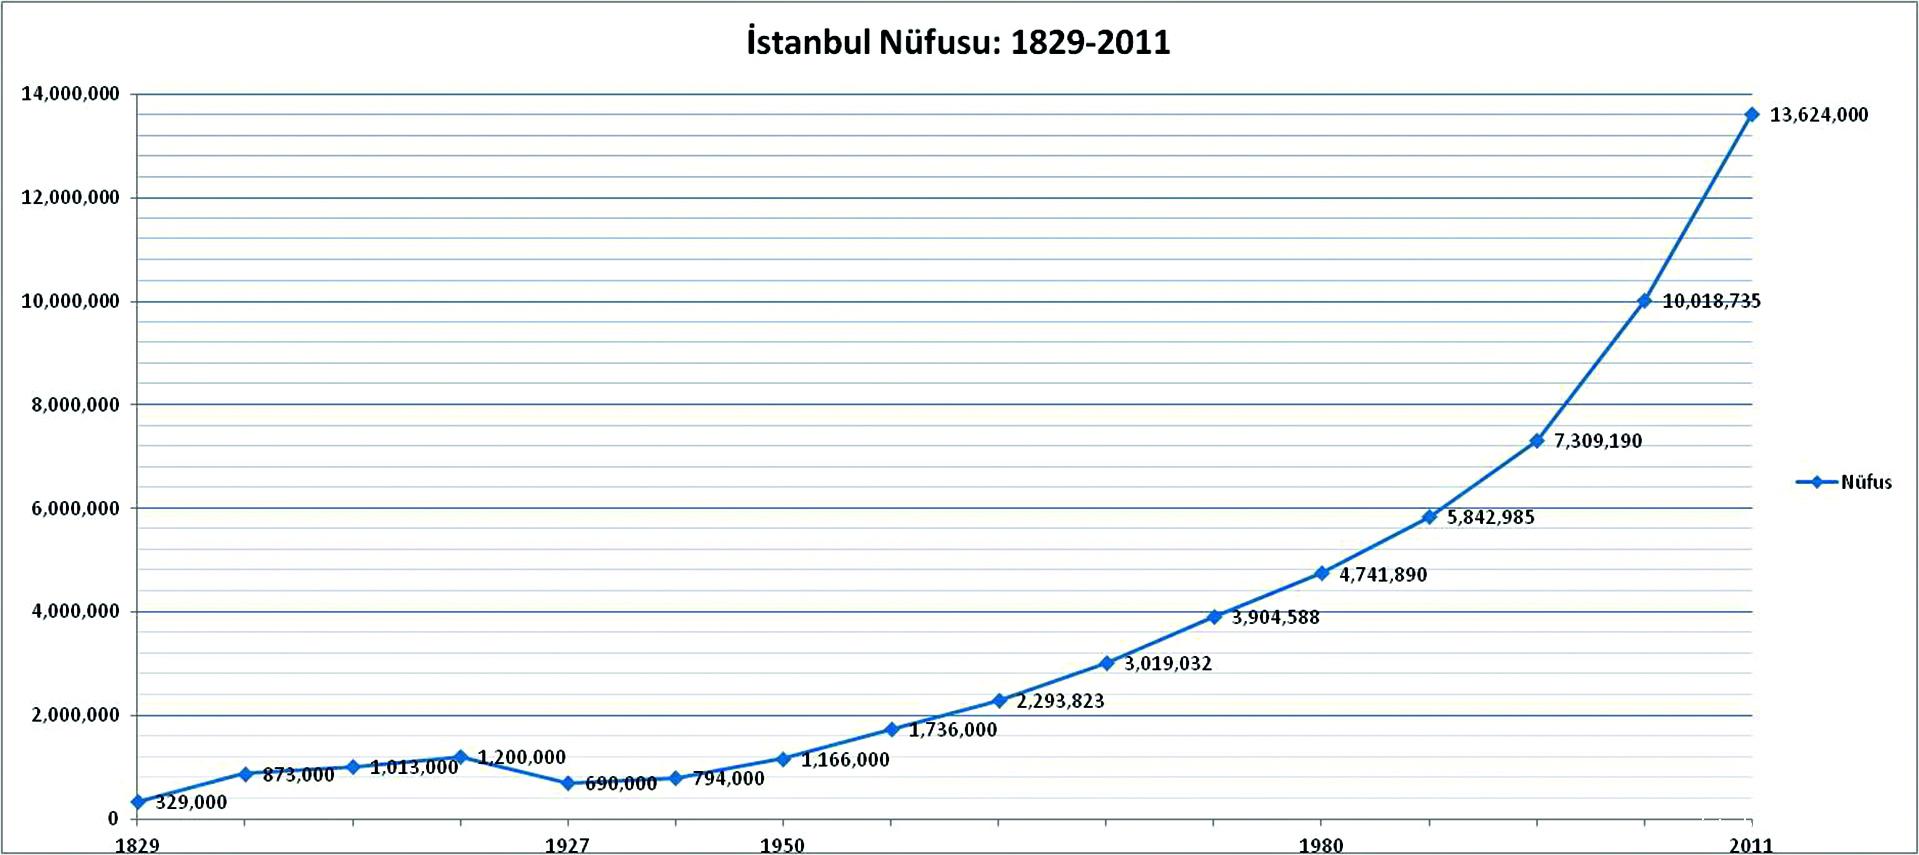
According to the first census conducted in 1927, 691,000 people lived within the municipality boundaries of Istanbul. This population was almost half the population of Istanbul during World War I. Despite the increase of the population between 1927 and 1950, Istanbul did not reach the size of its population during World War I (1,200,000). During the same period, the ratio of the population of Istanbul to the population of Turkey fell from 5.1% to 4.7%. This decline might be related to the fact that a large number of non-Muslims left the city; for the most part, Istanbul completed its demographic transition in the middle of the century and the internal migration was not high in this period. This rate started to rise rapidly after 1950. By 2012, the ratio of the population of Istanbul to that of Turkey was 18%. (Figure 1)At the same time, starting during the post-war period, the population of Istanbul began to become increasingly homogenous, losing its cosmopolitan nature. The population ratio of Muslims living in Istanbul between 1914 and 1965 increased from 61% to 93%. Parallel to this increase, the ratio of the Christian population dropped from 19% to 5%, and the Jewish population dropped from 5% to 1%. Income tax, which specifically targeted non-Muslims, and the tensions created by the events of September 6-7 led to the Islamization of Istanbul’s population.
Between 19352 and 1965, the ratio of the population whose mother tongue was Turkish increased from 78% to 95%. Meanwhile, the ratio of those whose mother tongue was Greek dropped from 9% to 1%; Armenian from 5% to 1%; and Hebrew from 4% to 0.4%. In this period, although a small number, the ratio of the population who indicated that their mother tongue was Albanian, Bulgarian, Arabic, Spanish, German or another foreign language decreased.
While the religious and linguistic demographics of the population of Istanbul increasingly became more homogenous, diversity on the basis of birthplace increased. In 1935, the ratio of residents of Istanbul who were born in the city was 57%. Starting from the 1950s, this ratio started to decline and dropped to 38% in 2000. At the same period, the ratio of those who were born in other cities, later to reside in Istanbul increased from 26% to 59%.
Population Size and Growth Rate
Since 1927 Turkey’s population increased nearly fivefold; however, Istanbul’s population increased twenty times over the same period. This was reflected in the records of the 2012 Adrese Dayalı Nüfus Kayıt Sistemi (ADNKS) (Address Based Population Registration System) where Istanbul’s population is registered as 13,854,740.
The annual population growth rate of a geographic region indicates the ratio of the population that changed as a consequence of births, deaths and migration rates as compared to the previous year.
In Turkey, the period of 1940-1945 is one in which the population growth rate reached its lowest point (10.6%) throughout Turkey, due to the increase in the number of men recruited to the army during the war, as well as the increase in deaths due to the concomitant deterioration in life conditions. (Figure 2) After 1950, the population growth rate began to rise. The year 1960 was recorded as the year with the highest population growth rate (28.5%). The population growth rate has continued to fall since 1960, except for small increases between 2008 and 2010; recently the population growth rate was recorded as 12.8%.
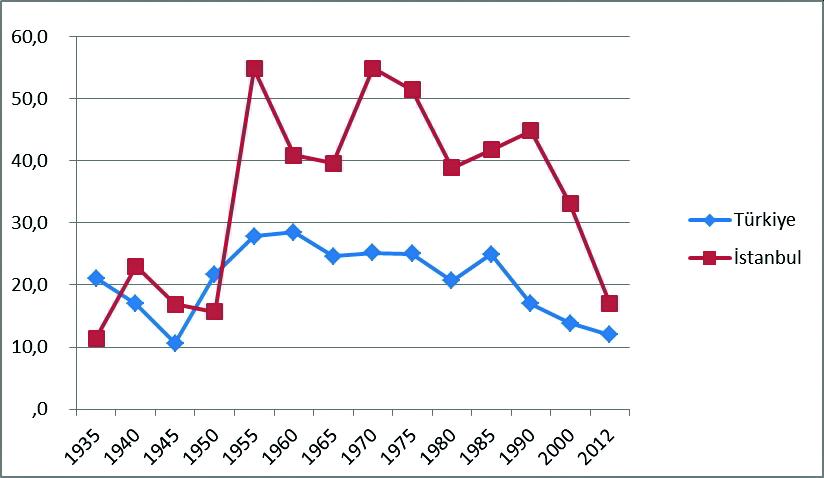
The population growth rate of Istanbul was quite above the Turkish average, particularly after 1950. In addition to this, it shows dramatic leaps that do not coincide with the changes in Turkey’s population growth rate with the exception of the World War II period. The most important reason for this is the internal migration to Istanbul that has been taking place since the middle of the century. According to research conducted by Özbay, until the 1990s, 35-40% of the increase of Istanbul’s population was due to natural causes, while 60-65% was due to migration. The first leap in the population growth rate was recorded in 1950 as 54.8%.
The reason for this rapid increase in Istanbul’s population, which was only 15.7% in 1950, is internal migration. Indeed, during this period, the growth rate recorded in the rural areas of Istanbul remained somewhat higher than urban growth. For example, in 1960, while the population growth rate of Istanbul in total was 40.9%, the population growth rate of rural Istanbul was 92.8%. Another leap can be seen in 1970 and a similar rural growth rate can be seen in this period to that of 1960. Since 1990, Istanbul’s population growth rate has started to decline. By 2012, with a rate of 17%, the population growth rate fell to the average level for Turkey. There can be no doubt that the exact migration rate declined due to the impact of migrants returning to their place of origin and the effect of the rapidly declining fertility rate.
The Rural-Urban Distribution of Istanbul’s Population
Since 1927, the population of Turkey has undergone a rapid transformation and the proportion of the rural population in 2012, dropped from 87.4% to 22%. (Figure 3) In other words, the rural and urban population rates swapped places within less than a century. The background and consequences of this transformation should be examined thoroughly. The rate urban population in Istanbul display entirely different figures to Turkey’s average. In 1927, 76% of the population of Istanbul was an urban population, this rate increased to 86%, gradually increasing until 1950, and finally in 2012, 99% of the population of Istanbul was urban.
However, between 1950 and 1980, the ratio of urban population in Istanbul constantly declined. One of the most prominent reasons for this is, as mentioned above, the fact that internal migrants to Istanbul settled in the outer regions of the city. At the same time, due to some administrative changes, some villages and towns were included within the city borders, the urban population which had declined to 61% in 1985 leaped back to 95%.
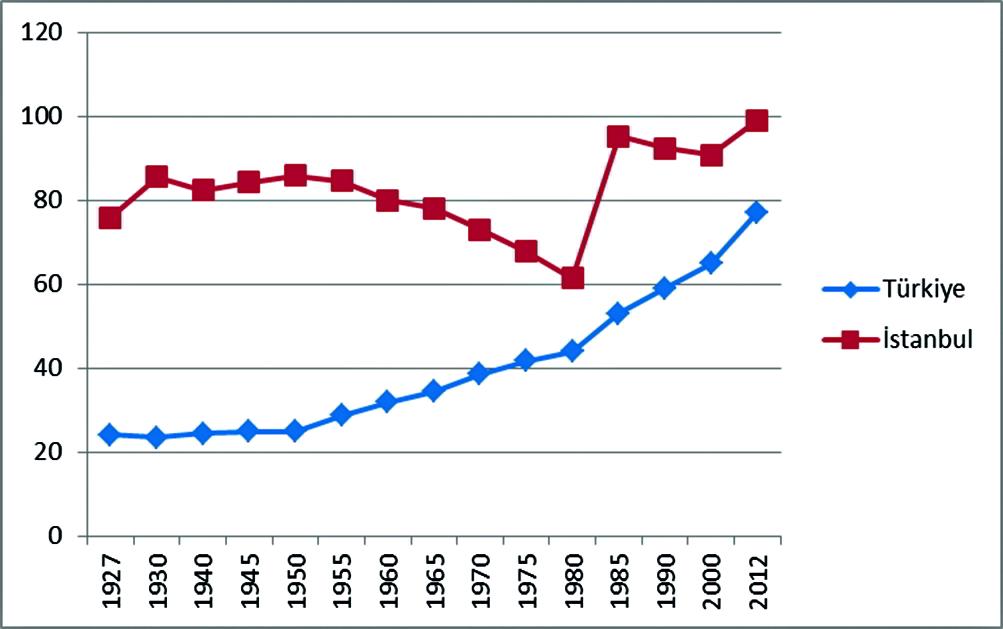
In other words, a population that ‘migrated from country to city’ without actually moving was created by the change in the data of the residential information of the population from rural to urban. The relative decrease in the urban population observed between 1985 and 2000 indicates the suburbanization and decentralization of Istanbul. In 2012, almost all of the population resided in the central part of Istanbul, with the remaining 1%, the rural population, residing in the sub-districts of Arnavutköy, Başakşehir, Beykoz, Çatalca, Çekmeköy, Eyüp, Pendik, Sancaktepe, Sarıyer, Silivri and Şile.
Population Density
Population density indicates the number of people per square kilometer. The area of Istanbul constitutes only 0.7% of Turkey. Despite this, in 2012 the population of Istanbul constituted 18% of the entire population of Turkey. As seen above, since the 1950s the growth rate of Istanbul’s population has remained higher than Turkey’s population growth rate. On the other hand, even before the population growth was accelerated by internal migration, Istanbul’s population density was greater than Turkey’s. For example, in 1940, there were 22 people per square kilometer in Turkey, but 178 people per square kilometer in Istanbul. In 1980, the rate for Turkey was 55 people, while for Istanbul it was 830. In 2000, the rate was 88 for Turkey and 1,928 for Istanbul. In other words, between 1940 and 2000, the population density of Turkey increased four times, while the population density of Istanbul increased eleven times. The share of internal migration towards Istanbul in this stunning increase is high.
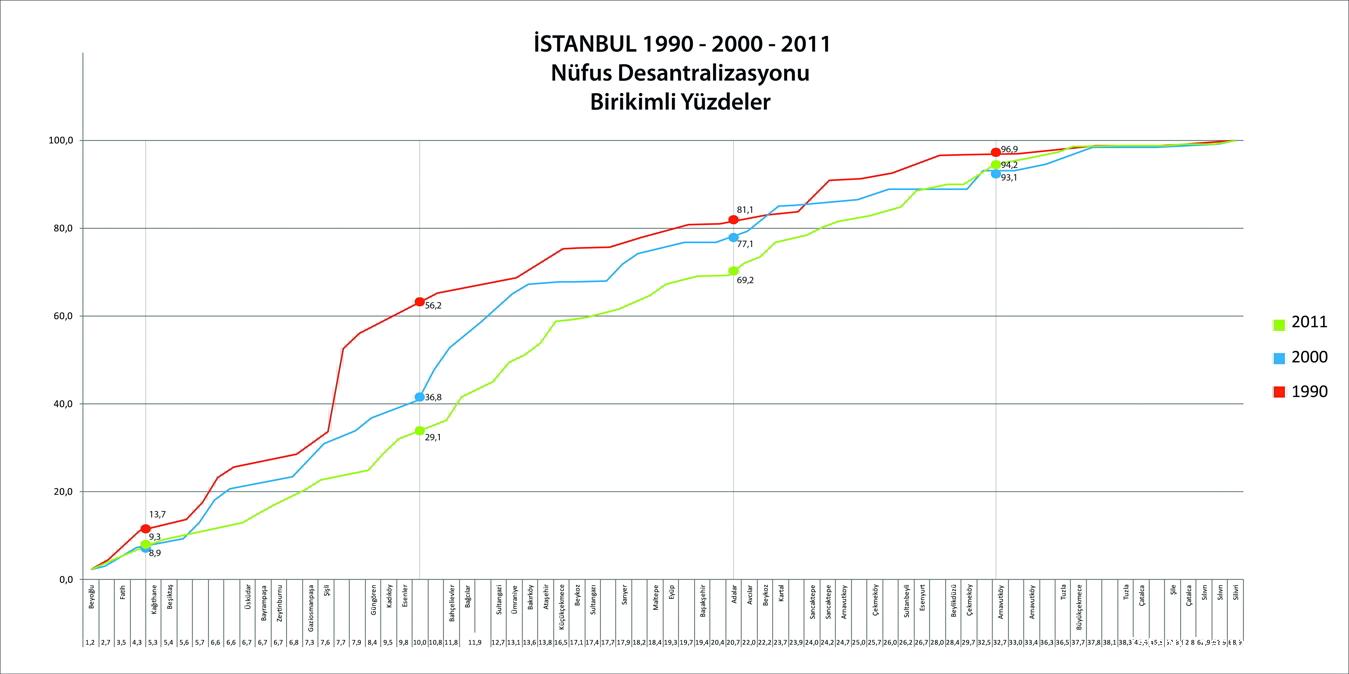
The reason for this high level of increase in Istanbul’s population density is that despite the fact that the population of Istanbul grew fourteen times in the 20th century, it stayed within the spatial borders that had become clear in the 19th century. (Figure 4) If we consider the Eminönü district to be the center of the city, in 1990, 14% of the population in Istanbul resided in districts within a 5 km zone around the centers such as Beyoğlu, Fatih and Kâğıthane. In 2011, this rate dropped to 9%. Again in 1990, when the zone encompassing the first 10 kilometers from the center is reviewed, more than half of the population (56%) resided in Üsküdar, Bayrampaşa, Zeytinburnu, Gaziosmanpaşa, Şişli, Güngören, Kadıköy and Esenler, in addition to the previously mentioned districts. In 2011, this rate dropped to 30%. If one takes into consideration that the population of Istanbul started to move away from the center to the periphery, it can be understood that there was a relative decrease in the ratios involved in the increase in population in this era. In addition to the districts mentioned above, if the districts in the first 20 kilometers are included, for example, Avcılar, Beykoz, Kartal, Sancaktepe, Arnavutköy, Çekmeköy, Sultanbeyli, Esenyurt, Beylikdüzü, between 1990 and 2011, a decrease in the population in these districts, falling from 80% to 70%, occurs. When the districts in the first 30 km radius are included, districts like Bahçelievler, Bağcılar Sultangazi, Ümraniye, Bakırköy, Ataşehir, Küçükçekmece, Beykoz, Sultangazi, Sarıyer, Maltepe, Eyüp and Başakşehir, it can be seen that both in 1990 and 2011 almost the entire population lived within the first 30 km that surrounded the center. The metropolitan population of Istanbul almost doubled in the period between 1990 and 2011, and the population came to reside in the zone that falls within the 60 km surrounding the city center. The “tentative and reluctant” population trends of decentralization from the last twenty years for both the European and Asian sides are reflected in the cumulative percentage curve. (Figure 4)
The Demographic Transition Process
The age distribution of the population provides important demographic, social, economic and political clues for the region. Fertility, mortality, marital status, family, labor market participation and important variables such as production and consumption rates for a region are directly related to the age distribution of the population. When the age structure of Turkey is examined under the three categories of children, working age population and elderly population, it can be seen that particularly after the 1970s the population between ages 0 and 14 dropped, and the working age, that is, between 15 and 64, and the elderly population of 65+ increased. In other words, Turkey entered a demographic transition process in these years.
The demographic transition process is from a demographic structure with high fertility and high mortality rates to a new structure in which birth is under control and death rates drop. This process, which was actualized within one hundred years in European countries, was completed in almost half that time in Turkey. In 1948, there was an average of 6.9 children per woman in Turkey. This rate steadily dropped to 2.38 in 2000 and in 2011 to 2.01.
|
Table 1- The age distribution of the population in Istanbul (1935-2011; percentages) |
||||||||||||
|
1935 |
1945 |
1950 |
1955 |
1960 |
1970 |
1975 |
1980 |
1985 |
1990 |
2000 |
2011 |
|
|
0-14 |
24.20 |
22.20 |
24.20 |
25.30 |
27.90 |
30.08 |
32.80 |
32.10 |
31.30 |
29.70 |
26.30 |
23.52 |
|
15-24 |
19.80 |
26.10 |
22.80 |
23.40 |
20.00 |
22.30 |
21.60 |
21.30 |
20.80 |
21.10 |
21.00 |
15.96 |
|
25-64 |
50.00 |
46.50 |
47.50 |
46.10 |
46.80 |
42.20 |
41.80 |
42.00 |
43.80 |
45.30 |
48.00 |
54.90 |
|
65+ |
5.40 |
5.10 |
5.50 |
5.10 |
5.10 |
4.70 |
3.60 |
4.30 |
3.80 |
3.80 |
4.70 |
5.62 |
In other words, the population managed to become almost self-sustaining. The dramatic drop in the population growth rate rapidly changed the population age structure of Turkey. While the share of young people in the total population rate decreased, the working-age population and the elderly population and their share in total population have increased. In a TÜSİAD (Turkish Industry and Business Association) report that was published in 1999, this situation was described as a window of opportunity for Turkey.3 According to this report, while the population growth rate dropped, the increase in the labor force created an economic opportunity that would increase the per capita income; thanks to social state expenditure, better quality services could be offered to the same number of citizens. Taking advantage of this economic opportunity would depend on the creation of employment opportunities for the rapidly growing working-age population. On the other hand, as a result of this process, it was observed that a new problem would soon face Turkey: the issue of an aging population. Instead of investments in primary schools or even universities, as fertility declines and the number of the younger population remains stable, social security policies directed towards the aging population in matters such as pensions, housing and shelter, as well as healthcare services would have to be revised.4 Indeed, these opportunities and threats that were first identified in 1999, are still valid today.
When the age structure of the population of Istanbul is compared to that of Turkey, it can be seen that in 1935 the child population in Istanbul was lower; however, despite this, the working-age population (19 to 64) was higher. In 2000, this gap almost disappeared; while the child population in Turkey decreased overall, the working-age population increased, and the demographic transition process was completed. What is interesting here is that Istanbul started to experience a demographic transition much earlier than Turkey. When the relatively low birth rate in Istanbul is considered, Istanbul could have completed this process much more rapidly if the young migrants (of fertility age) who came to Istanbul had not brought their ‘unborn children’ along.
Age Distribution of the Population in Istanbul
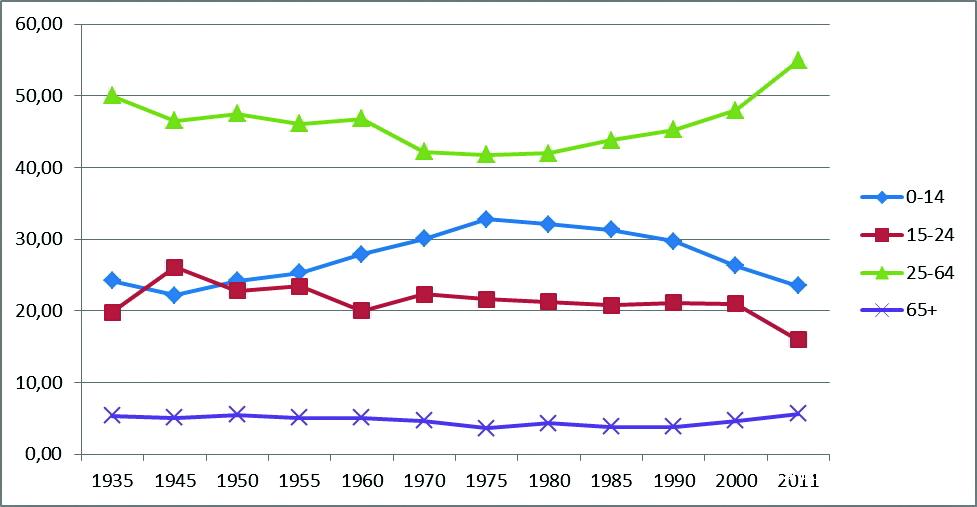
The age distribution of the population of Istanbul is examined under four groups: children (0-14), working-age youth (15-24), working-age adults (25-64), and elderly (65+). (Figure 5 and Table 1) When the population of Istanbul is examined between 1935 and 2011, the year 1975 forms a turning point for the child and working-age adult population. After that year, while the child population began to decrease rapidly, adult population began to increase. In 2011, 55% of the population was of working age. This rate is the highest rate in the history of post-Republic Istanbul. In 2000, the rate of 65+ elderly population was 4.7% and in 2011, it was 5.62%. The demographic aging concept that can be seen in countries which have completed the demographic transition demonstrated an early impact on Turkey’s rural areas, rather than on the metropolitan areas. On the other hand, when the rapidly increasing elderly population rates are considered with the impact of the drop in birth rates and slowed internal migration, demographic policies regarding old age in Istanbul and other cities need to be revised. In particular, since the 1970s, the percentage of the population made up of the elderly has been below the average in Turkey due to the quantity and quality of internal migration to Istanbul. Istanbul had the advantages of a young and an economically active population. The tendency of the young population to decrease and the old population to increase should be a priority on the agenda of social politicians and decision-makers, as it is closely related to socio-economic conditions and Istanbul’s labor market.
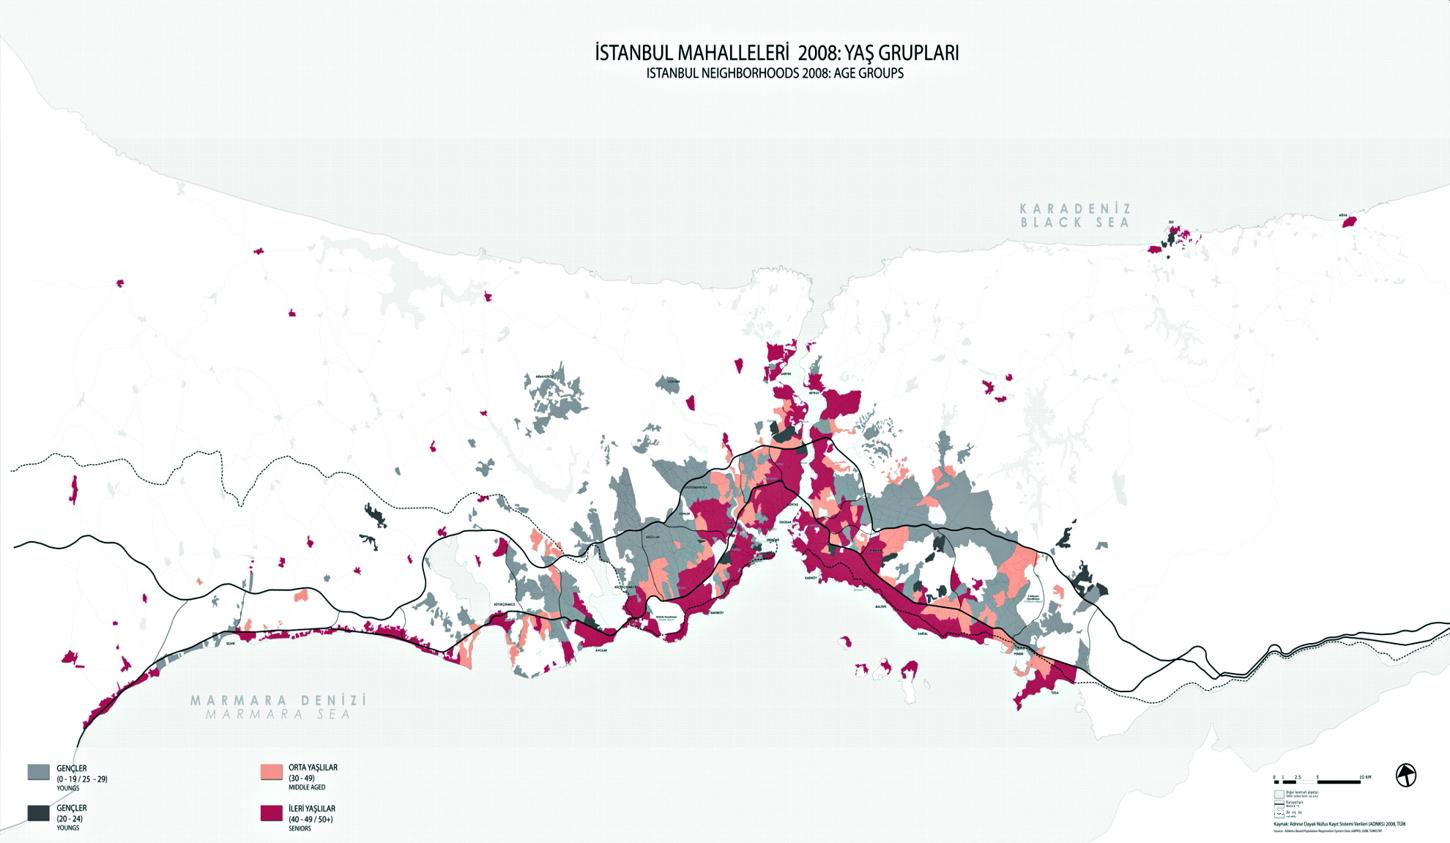
When the distribution of dominant age groups in Istanbul with respect to neighborhoods is viewed, a striking map emerges. (Map 1) It can be seen that older age groups reside in neighborhoods in the triangle defined by relatively older coastal settlements, while younger age groups reside in the neighborhoods that were predominantly settled by migrant population, on the axis of the second ring road. It can clearly be seen on the map that the middle age group (30-49) is concentrated almost in a buffer zone between these two regions. When Istanbul’s social geography is mapped, a very similar relationship between education level and socio-economic status to age distribution can be seen.5 Those with high education and upper socio-economic status, as well as the older age groups, are concentrated on the coast; those with low education and low income, as well as the young population, are concentrated in peripheral districts close to the TEM motorway. Despite the complexity of the process of urban growth, the social geography of the Istanbul metropolitan area can be read quite clearly.6
Fertility
Increase and decrease in population is a consequence of birth, death and migration rates. When death rates are relatively fixed, it can be understood that birth and migration rates have a greater effect on population change. Apart from the numerical increase or decrease in population, the age structure of the population, and thus, the social and economic characteristics are affected by birth and migration trends. The demographic transition process, as discussed above, is one of the consequences of the change in fertility charting. Fertility has demographic, social, economic and cultural aspects. Despite its very complex nature, attempts to control fertility through various policies have been made in all periods. For example, in Turkey, while pronatalist policies, such as providing financial support to women who give birth to their fifth child, restrictions on import and sales of birth control methods and abortion were applied until 1965, in 1965 antinatalist policies were introduced with the implementation of the Family Planning Act. This change was driven by the pressure of population growth in major cities along with the health risks posed by illegal abortions and the increases in infant and maternal mortality during childbirth. It can be said that these policies have an effect on fertility, but it is very difficult to measure the exact results. Because fertility is a complex issue in which many variables are effective, it is almost impossible to change its course with any type of population planning policy. Even though the recent recommendation of ‘at least three children’ by the politicians in Turkey targets the control of fertility rates that are in rapid decline, the issue of fertility has a complex structure which cannot be controlled with such policies. Among the factors that affect fertility are variables such as cultural values, religious values, economic situation, education level, employment of women, civic center position (rural - urban), as well as demographic variables, such as age and marriage rates.
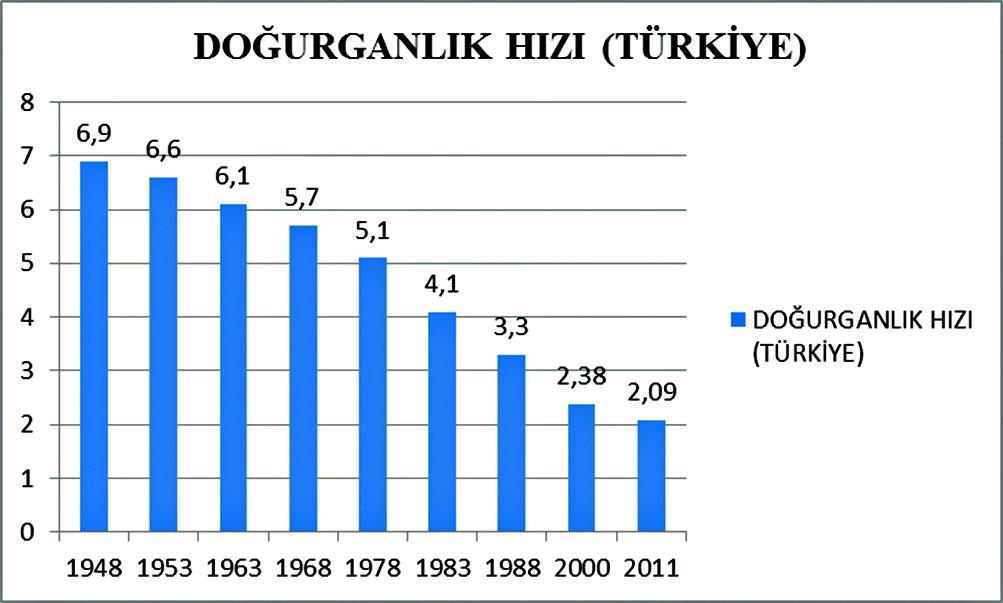
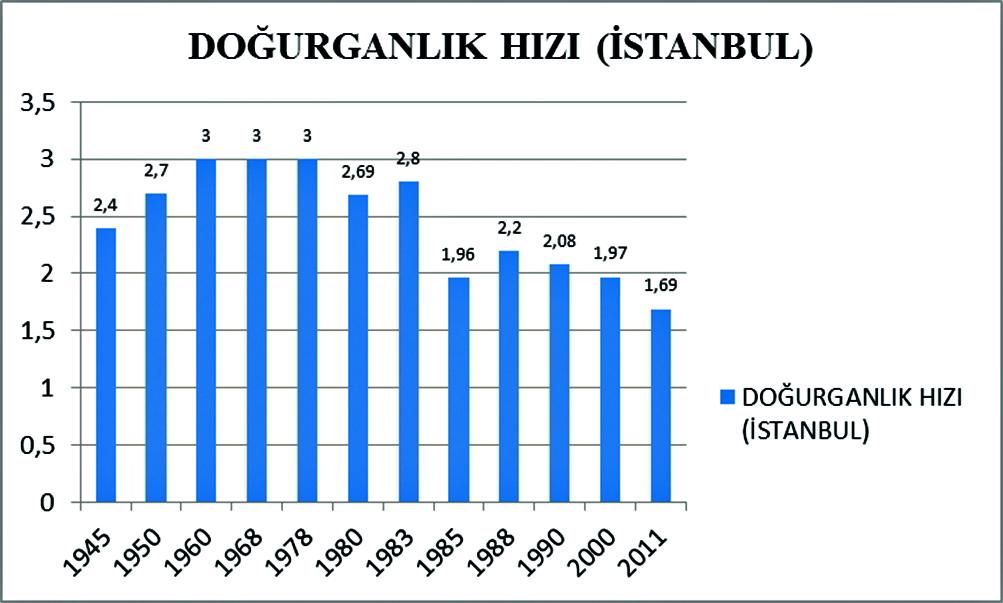
Since the mid-20th century, the fertility rate in Turkey has rapidly and dramatically declined. In the same period, in Istanbul it has been substantially below Turkey’s average, while since mid-century the fertility rate has fluctuated. In particular, the increase after 1950 is a result of the migration of population of a fertile age to Istanbul. However, even in this growth period in Istanbul, the fertility rate did not exceed 3% and has remained at almost half the rate of the rest of Turkey. This rate stayed under 2% after 2000 and in 2011 dropped to 1.69%. (Figures 6 and 7).
Internal Migration
In order to understand the dynamics of migration to Istanbul and migrant profiles, the migration area of Turkey and migration movements that were shaped by various social and economic conditions in different periods in Turkey need to be understood.
Turkey’s history of internal migration overlaps with the country’s social history and can be examined in four general periods:
The end of the 19th century-1927. This is the first period, referred to by Tekeli as ‘tentative modernization’: the politically motivated Balkanization migration.
1923-1950. The radical modernization period of the single-party era: the population exchange between Greece and Turkey in the post-Republican period and forced migration.
1945-1980. The multiparty populist modernization: rural-urban migration that supported the urbanization process.
1980. The neoliberal period: urban-urban migration.7 When the migration history of Turkey is examined, one can observe the ‘Balkanization migration’ that developed as the Muslim population which had been left out of Ottoman territories sought refuge in Anatolia en masse during the period in which many nation states emerged from the Ottoman state.8 There is clear evidence that prevents us from considering the economic basis for internal migration movements as insignificant. However, not much is known about the internal migration that was shaped by the Ottomans’ refugee policy, which came about for political reasons.9 Again, towards the end of the century, seasonal migration started from the villages which had become unsuitable for farming due to drought, erosion, earthquakes or landslides. It has been alleged that this formed the basis of ongoing seasonal migration.10 According to the census of 1927 three-quarters of the population still lived in rural areas and the urban population increased by only 1% before the 1950 census.11 Starting at the proclamation of the Republic until the 1950s, a ‘forced’ migration and resettlement policy was followed; this can be perceived as a continuation of the Ottoman refugee policy and was aimed at creating a homogenous population with respect to religion. The population that immigrated was placed in villages for farming, but until the 1950s, the state did not encourage migration from country to cities, except for compulsory reasons.12
Istanbul began to receive more immigrants from the 1950s onwards. Between 1945 and 1950, while only 214,000 people migrated from rural to urban areas, in the period between 1950 and 1955, this number increased to 904,000.13 This leap was generally explained by the promulgation of liberal economic policies and the agricultural mechanization process (increase in the number of tractors), which resulted in a lesser need for labor in rural areas,14 thus causing a population that increasingly migrated to urban areas.
On the other hand, the migration period cannot be completely explained by driving factors in rural areas. The continuity of the process of rural to urban migration can only be explained by considering the changes in cities. For example, an indicator of the role that cities played in these migration movements is the fact that in the 1950s the Democratic Party started to support the national bourgeoisie due to the industrialization and urbanization potential, particularly in Istanbul.15 Piore explains the formation of migration by relating it to the inevitable, structural and chronic need for labor in the places of immigration rather than the driving forces of unemployment and poverty in the places of emigration.16 According to this theory, the internal dichotomy between labor and capital creates a segmented labor market with secure and highly paid jobs on the one end, and insecure, low-paid jobs, on the other. At this juncture in the labor market, the domestic demand for insecure, low-paid jobs is low and the need for immigrant labor is a consequence of this. The dichotomy between capital and the labor-intensive sectors, which started to crystallize in the 1950s, increased the attractions of the city. As can be seen, the migration studies, that did not take into account the fractionation between the labor market and the relational connections between the places from which people emigrated and those to which they immigrated, inevitably tell only one side of the story and miss the important aspects of migration patterns.
Even though “rural-urban migration” is the most stereotyped, problematized and the most frequently highlighted migration type among internal migrations, it does not carry great weight in figures. In fact, between 1965 and 1970, 39.2% of the total migration was from city to city and only 27.4% of the total migration was from villages to cities. The gap quickly widened. Between 1980 and 1985, these rates were, 56.2% and 22.5% respectively. Thus, even though rural-urban migration kept its qualitative importance, it is a type of migration that is day by day losing its relevance quantitatively. Moreover, the fact that by the 1960s the number of migrants emigrating from Turkey to other countries had increased affected the dynamics of internal migration. In this sense, thousands of people first migrated within the country and then emigrated abroad. Some of the migrants that returned to Turkey from abroad settled in different regions.17
Since the end of the 1950s, rural-urban internal migration - especially to Istanbul and Ankara - has been the subject of much research in Turkey.18 This research covered the migration policies and the integration process of the migrants to city life, the transformed dynamics of urbanization due to migration, as well as the context of rural-urban migration. This research is the pioneer of an area that was later referred to as ‘slum studies’, which highlighted different variables, such as networks of relationships, employment and housing, as well as the forms of integration of the immigrants. However, an alternative methodology which made use of macro data as a part of quantitative research, using variables such as the speed of migration, net migration, the rates of return and the share within the total internal migration, was not developed. This research addresses the issues of integration and urbanization that emerge as a result of migration rather than relational and even circular movements of the two migration settlements. There is a need for more studies to examine the dynamics and movements of migration so as to create a theoretical background and to create an empirical basis of urbanization, integration and slum studies.
The proportion of rural-urban migration in total migration dropped to 13% in the 1985-1990 period. The migration movements between cities gained momentum. This section will present the results of a study19 conducted recently on the internal migrations that occurred between 1985 and 1990, and 1995 and 2000 in Istanbul. This research is important in the sense that it addresses migration movements from both quantitative and qualitative aspects. It constitutes a solid empirical background for research which examines the changing dynamics before and after rural and urban migration.
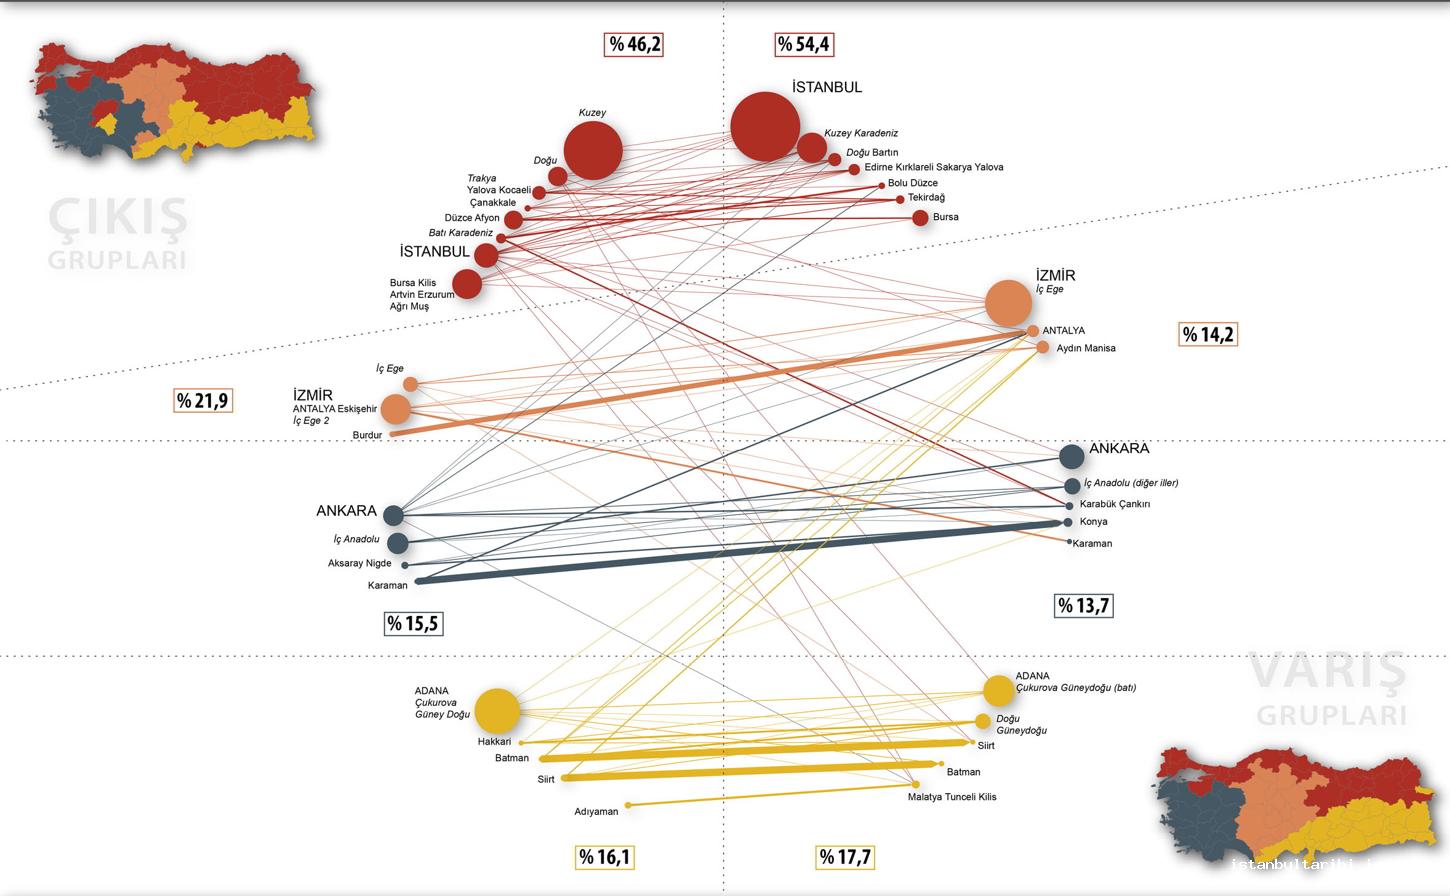
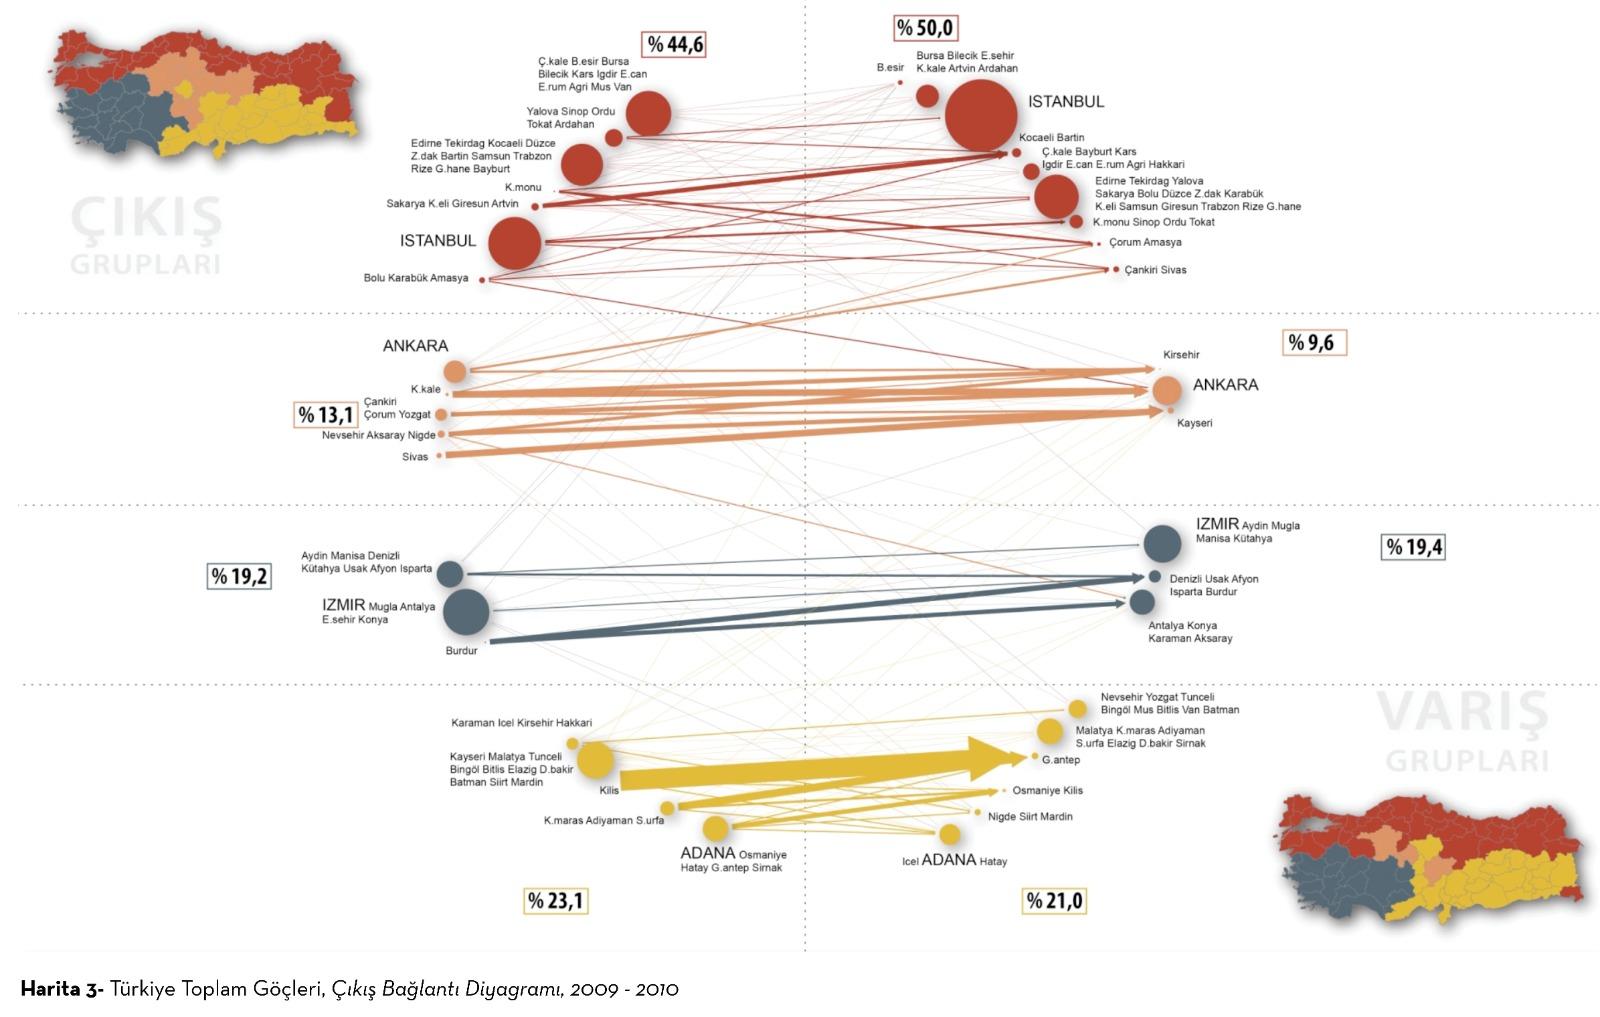
When the internal migration patterns are examined, the historical determination of the migration patterns can be clearly seen.20 Istanbul, Ankara, İzmir and Adana are four main areas of migration that can easily be identified by looking at the distinctive features of origin and destination in Turkey for the periods from 1985 to 1990, and 1995 to 2000. It is observed that the Eastern Marmara, the northern province of Thrace, provinces neighboring Ankara and Central Anatolia, the inner Aegean region of İzmir, and Çukurova and Southeastern regions near Adana are among the same migration areas. While the migrants who emigrated from these areas arrived at similar destinations, those migrants who finished their journey came from similar regions of origin. Focuses of migration are Istanbul, Marmara, the North and Northeast. The cities that receive the most intensive migration are from these provinces and again these cities also have the most intensive emigration. In 2010, it can be observed that in Istanbul the most visible origin and destination connections did not change, except for very small numerical differences. Because no data about migration was recorded in the 1950s census, the information for that period was attained via population registration data based on place of birth. It is possible to see representatives of northern cities, including those from the Black Sea and Thrace, among those who reside in Istanbul but were not born in the city.21 (Maps 2, 3, 4)
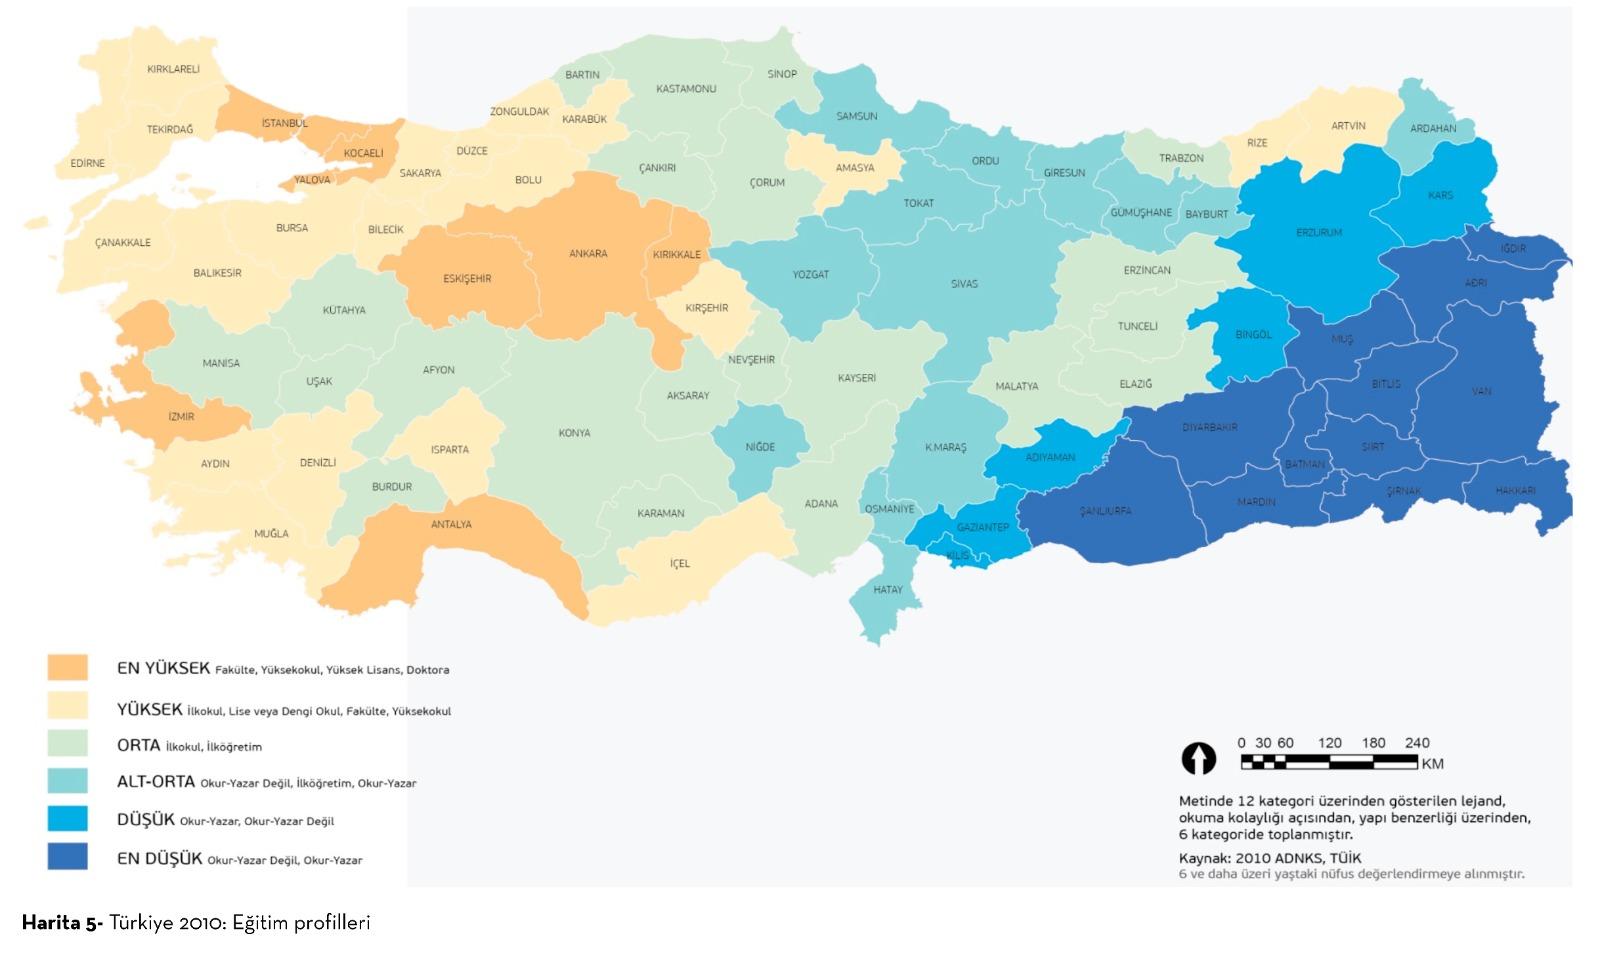
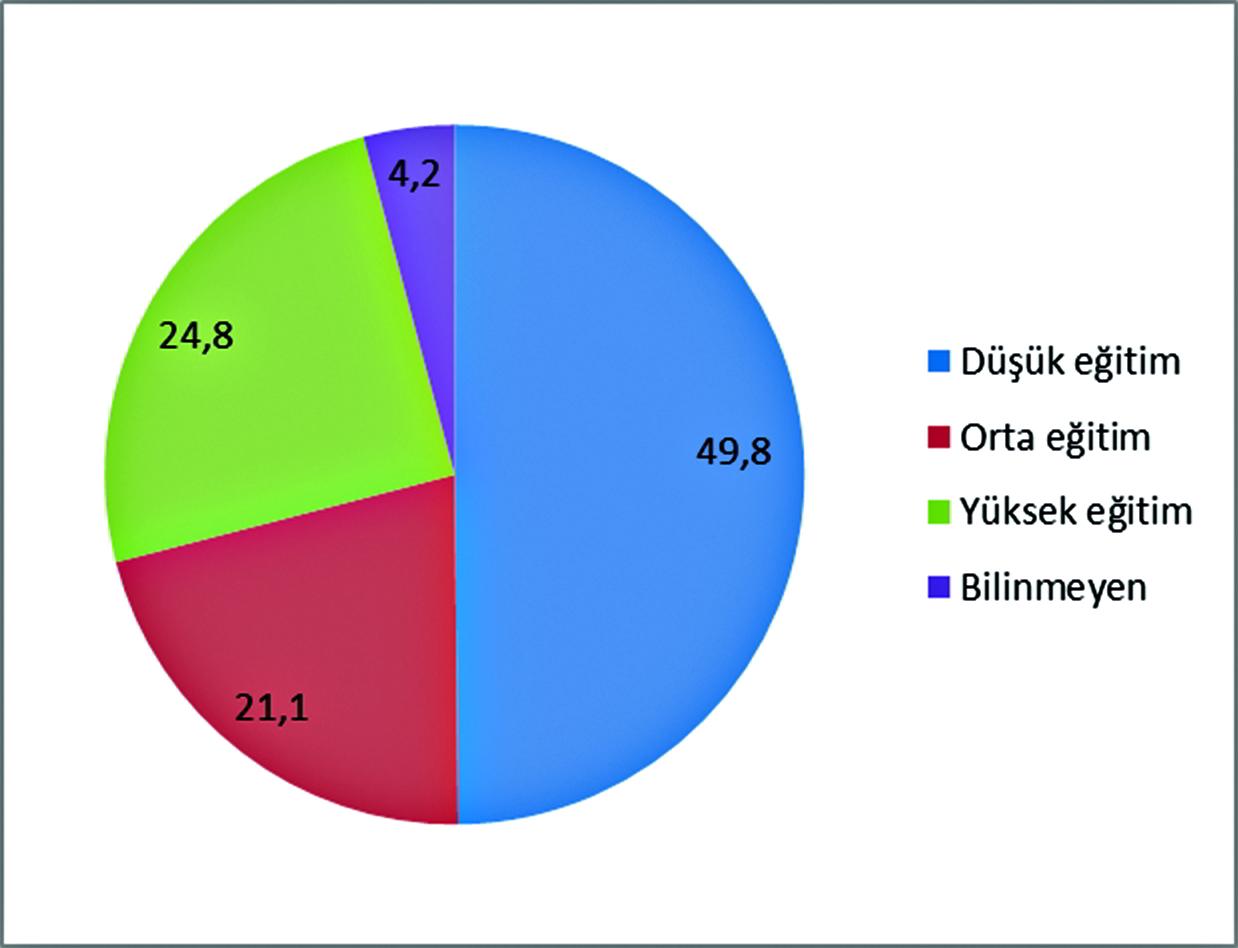
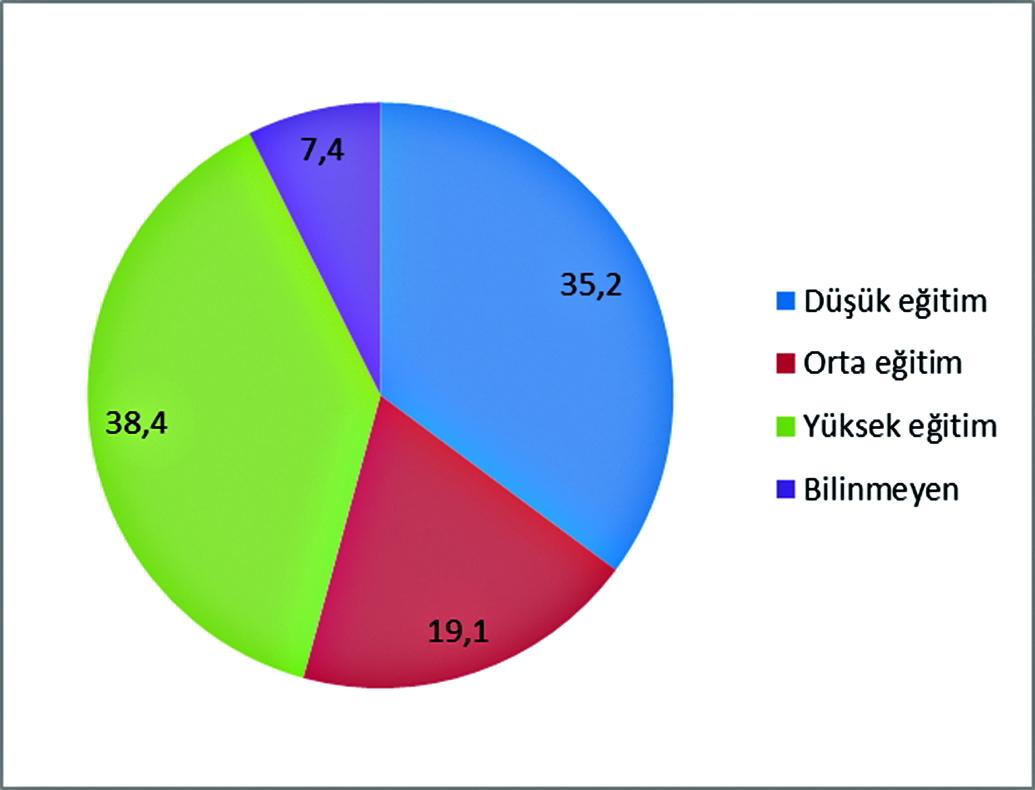
The educational profile of 406,323 immigrants who came to Istanbul between 2009 and 2010 is higher than the Turkish average. While those with lower level education (primary school graduates or those without any diploma) make up 50% of the population in Turkey, among the immigrants who came to Istanbul, this rate is 35%. On the other hand, while the rate of those with a high school diploma or above is 25%, this rate is 38% among those who immigrated to Istanbul. (Figures 8 and 9)
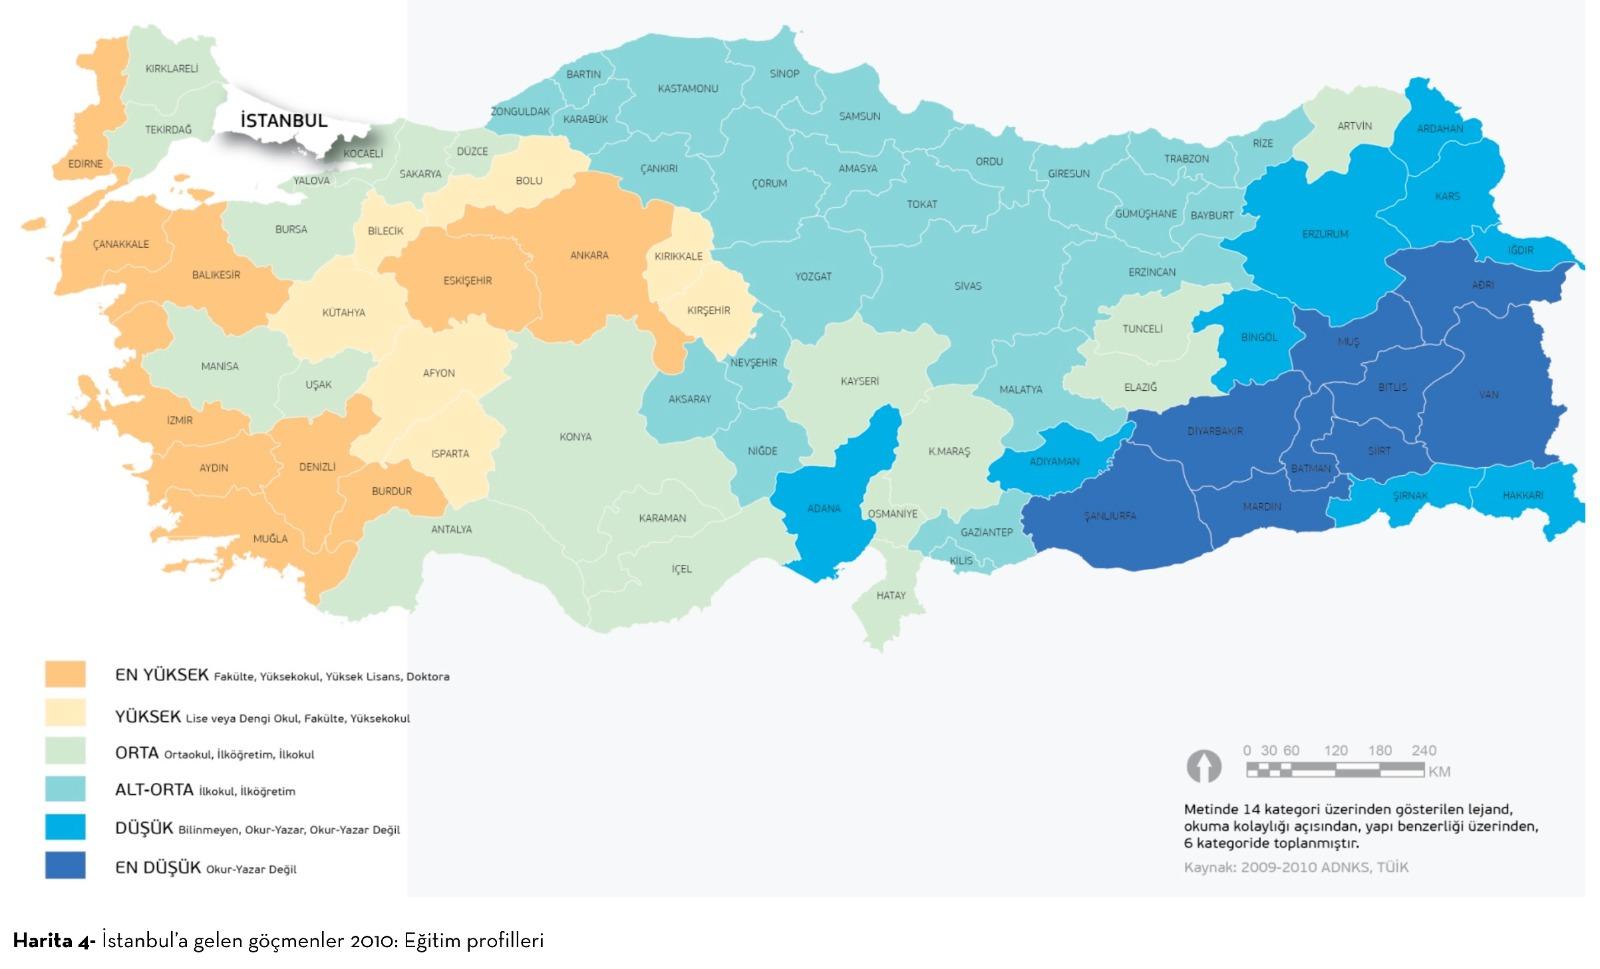
The educational profile of immigrants who came to Istanbul exhibits important differences in terms of region of origin. If the migration from the cities of Istanbul’s urban regions (Tekirdağ, Kocaeli, Yalova, Bursa, Sakarya or Düzce) is eliminated, the migrants who come to Istanbul generally carry the dominant educational profile of the regions from which they originate. However, the educational profile map of migrations that terminate in Istanbul is, in general, close to Turkey’s education map. (Maps 5 and 6) The migrants coming from the East and Southeast have the lowest educational profile and those coming from western cities, Ankara and Eskişehir have the highest educational profile. In contrast, while the educational profiles of the cities in the Marmara region are high, the educational profile of migrants who migrated to Istanbul from (Istanbul’s) urban region is moderate. Istanbul’s urban region sends highly educated migrants to Ankara and relatively low-educated migrants to Istanbul itself. A similar pattern is observed between Ankara and neighboring provinces.
It can be observed that among the migrants that Istanbul receives, the highest number of migrants are from the Black Sea and northern cities; these migrants, for the most part, have lower educational profiles. The educational profile of the Western and Eastern Black Sea provinces is higher than that of the Central Black Sea provinces and Turkey in general. However, immigrants from the Black Sea to Istanbul do not reflect these differences.
Conclusion
The future projections of the population of Istanbul are lower than expected, if one does not take into consideration the factors of recent low fertility or relatively declining immigration factors.22 If there is not any positive net migration (the difference between the immigration to and emigration from Istanbul), it is expected that population growth will halt in the 2030s; it is expected that in the 2040s there will be a decrease of population. Again, in the same population projection, the proportion of those over 65 is expected to increase and the proportion of those in other age groups is expected to decrease. In Istanbul, which has not completed its demographic transition, it is estimated that the fertility rate will drop to 1.61% by 2050, and, in parallel with an increase in the elderly population, the annual number of deaths will be higher than births.23 On the other hand, the importance of immigration is undeniable in population growth and structure. In the future, the magnitude and characteristics of migration to Istanbul may alter the size and structure of the city’s population. The demographic and social history of Istanbul, one shaped by complex factors, can be examined by dividing it into three unique periods: 1923-1950, 1950-1980 and after 1980.24
However, looking at the demographic and social geography of Istanbul, it can be claimed that it reproduces itself extensively. Particularly after the Republic, the continuity of the integration of different demographic and socio-economic groups to the city is striking. However, the large-scale projects that are being accomplished or have been planned in recent years, such as the third bridge and the Marmaray, have the potential to change the social geography of Istanbul. Large scale projects like these should be taken into account together with factors such as birth, death and migration when making projections regarding the population and social geography of Istanbul.
BIBLIOGRAPHY
Güvenç, M., “Küreselleşme Bağlamında İstanbul’a Göç ve İstanbul’dan Göç”, Eski İstanbullular, Yeni İstanbullular, prepared by M. Güvenç, Istanbul: Osmanlı Bankası Arşiv ve Araştırma Merkezi, 2009, pp. 130-140.
Murat, S., Dünden Bugüne İstanbul’un Nüfus ve Demografik Yapısı, Istanbul: İstanbul Ticaret Odası (İTO), 2006.
Shorter, F.C. and Bozkurt Güvenç (ed.), Turkish Demography: Proceedings of a Conference, Ankara: Hacettepe University, 1968.
Shorter, F.C. and Miroslav Macura, Türkiye’de Nüfus Artışı (1935-1975): Doğurganlık ve Ölümlülük Eğilimleri, Ankara: Yurt Yayıncılık, 1983.
FOOTNOTES
1 İ. Tekeli, “Modernleşme Sürecinde İstanbul’un Nüfus Dinamikleri Nasıl Değerlendirilmeli?”, Eski İstanbullular, Yeni İstanbullular, prepared by M. Güvenç, Istanbul: Osmanlı Bankası Arşiv ve Araştırma Merkezi, 2009, pp. 11-34.
2 Many demographic variables were included in the 1935 census, a fact that facilitates the evaluation in relative detail of the demography of Turkey after the Republic.
3 Türkiye’nin Fırsat Penceresi: Demografik Dönüşüm ve İzdüşümleri, Istanbul: Türk Sanayicileri ve İşadamları Derneği (TÜSİAD), 1999.
4 Türkiye’nin Fırsat Penceresi.
5 P. Derviş and Meriç Öner (ed.), Mapping Istanbul, Istanbul: Garanti Galeri Yayınları, 2009.
6 M. Güvenç, “Social Geography of Istanbul: An Overview”, Mapping Istanbul, ed. P. Derviş and Meriç Öner, Istanbul: Garanti Galeri Yayınları, 2009.
7 İ. Tekeli, Göç ve Ötesi, Istanbul: Tarih Vakfı Yurt Yayınları, 2008; F. Özbay and B. Yücel, “Türkiye’de Göç Hareketleri, Devlet Politikaları ve Demografik Yapı”, Nüfus ve Kalkınma: Göç, Eğitim, Demokrasi, Yaşam Kalitesi, ed. F. Özbay et al., Ankara: Hacettepe Üniversitesi, 2001.
8 Tekeli, Göç ve Ötesi.
9 Özbay and Yücel, “Türkiye’de Göç Hareketleri”. It is known that even in the 19th century, there was a high level of migration from villages to the industrial ports that started appearing in the Mediterrenean and Black Sea.. (K. Karpat, The Gecekondu: Rural Migration and Urbanization, Cambridge: Cambridge University Press, 1976). Later on, due to long-lasting wars, trade was extensively hampered and people returned to their villages.
10 Karpat, The Gecekondu.
11 H. I. Taş and D. R. Lightfoot, “Gecekondu Settlements in Turkey: Rural-urban Migration in the Developing European Periphery”, Journal of Geography, 2005, vol. 104, issue. 6, pp. 263-271.
12 Özbay and Yücel, “Türkiye’de Göç Hareketleri”.
13 B. Akşit, “İç Göçlerin Nesnel ve Öznel Toplumsal Tarihi Üzerine Gözlemler: Köy Tarafindan Bir Bakış”, Türkiye’de İç Göç: Sorunsal Alanları ve Araştırma Yöntemleri, ed. Ahmet İçduygu, Istanbul: Türkiye Ekonomik ve Toplumsal Tarih Vakfı Yayınları, 1998. After this large increase, there were two more increases in migration from rural to urban areas. Between 1960 and 1965, 1,900,000 people migrated from rural to urban areas and between 1985 and 1990, 2,600,000 people followed the same route.
14 In contrast, Tekeli thinks this is nothing more than an illusion. He asserts that with the introduction of tractors, the number of fields that could be farmed increased greatly and the increase in rural labor demand increased accordingly. He also advocates that urban demand should be taken into account when explaining migration. (Tekeli, Göç ve Ötesi)
15 Özbay and Yücel, “Türkiye’de Göç Hareketleri”.
16 M. J. Piore, Birds of Passage: Migrant Labor and Industrial Societies, New York: Cambridge University Press, 1979.
17 A. İçduygu and T. Ünalan, “Türkiye’de İç Göç: Sorunsal Alanları ve Araştırma Yöntemleri”, Türkiye’de İç Göç, ed. A. İçduygu, Istanbul: Türkiye Ekonomik ve Toplumsal Tarih Vakfı Yayınları, 1998.
18 İ. Öğretmen, Ankara’da 158 Gecekondu, Ankara: Ankara Üniversitesi Siyasal Bilgiler Fakültesi, 1957; İ. Yasa, Ankara’da Gecekondu Aileleri, Ankara: Sağlık ve Sosyal Yardım Bakanlığı, 1966; T. Yörükhan, Gecekondulular ve Gecekondu Bölgelerinin Sosyo-kültürel Özellikleri, Ankara: Imar ve Iskân Bakanlondu Bölgelerinin Sosyo-kültürel Öz 1968; C. Hart, Zeytinburnu Gecekondu Bölgesi, translated by Nephan Saran, Istanbul: İstanbul Ticaret Odası, 1969; F. Akçay, Zeytinburnu: Gerçek Yönleriyle Bir Gecekondu Kenti, Istanbul: Akçağ Basım Yayım Pazarlama A.Ş., 1974; Karpat, The Gecekondu.
19 Murat Güvenç and Özge Aktaş Mazman, “Türkiye İç Göç Çalışmalarında Yeni Bir Evreye Doğru:1985-1990, 1995-2000 Göç Akımları ve Göçmen Profilleri”, TÜBİTAK Araştırma Projesi, 2011-2014. The analysis of this project is being prepared by Elvan Erginli, while the figures and maps have been prepared by Ebru Şener.
20 Migration maps and diagrams were created using a layering method in order to make the process of how migration areas were grouped more understandable and to create a reciprocity analysis between origin and destination areas of migration in Turkey. In this process, statistically meaningful migration trends were revealed by grouping the cities from which emigration occurred (leaving groups) with similar places and the cities to which immigration occurred (destination groups) with similar areas. The thickness of the lines in the diagram show the intensity of migration flows. The size of the points indicates the magnitude of the received migration.
21 The maps were prepared for a TÜBİTAK Research Project by Güvenç and Aktaş Mazman titled “Türkiye İç Göç Çalışmalarında Yeni Bir Evreye Doğru”.
22 A. S. Türkyılmaz and S. Yavuz, “2000’li Yıllarda İstanbul Nüfusu: Yeni Gelişme Eğilimleri”, Eski İstanbullular ve Yeni İstanbullular, prepared by M. Güvenç, Istanbul: Osmanlı Bankası Arşiv ve Araştırma Merkezi, 2009.
23 Türkyılmaz and Yavuz, “2000’li Yıllarda İstanbul Nüfusu”.
24 Tekeli, “Modernleşme Sürecinde İstanbul’un Nüfus Dinamikleri Nasıl Değerlendirilmeli?”
